
aws grafana, prometheus 구성_3
이제 grafana 를 구성한다.
모니터링 서버
docker run -d --name=grafana -p 3000:3000 grafana/grafana

AWS 작업
콘솔 - 모니터링 서버 우클릭 - 보안 - 보안 그룹 변경 - 3000 포트 열기

모니터링 서버 ip:3000

admin / admin 으로 접속 후
Coneections - Data sources - prometheus
prometheus 가 실행되고 있는 서버 ip (여기선 prometheus 와 grafana 가 같은 서버에서 실행되고 있음)
아래에 save & test 클릭
Grafana 대시보드 구성
import 해와도 되지만 간단하게 구성해보기
prometheus 클릭
오류
쿼리를 입력했는데 아무 값이 안 뜨길래 확인해보니
1. 해당 서버(모니터링 서버)에 IAM Role 을 미적용,
2. role 의 신뢰 관계 문제
발생한 오류 : a_acount_ec2 컨테이너에서 발생
software.amazon.awssdk.services.sts.model.StsException: User: arn:aws:sts::acount_id:assumed-role/cloudwatch_exporter_role/instance_id is not authorized to perform: sts:AssumeRole on resource: arn:aws:iam::acount_id:role/cloudwatch_exporter_role (Service: Sts, Status Code: 403, Request ID: e3e1e3e3-951b-4a83-af32-f97587e6dc2d)
prometheus 에서 이렇게 cpu 로 검색 시 CPUUtilization 가 없으면 수집에 문제가 있는 상태
오류 해결 1
처음 생성한 cloudwatch_exporter_role 을 적용하고
(콘솔 - 모니터링 서버 - 우클릭 - 보안 - IAM 역할 수정)
역할 - cloudwatch_exporter_role 클릭 - 신뢰 관계
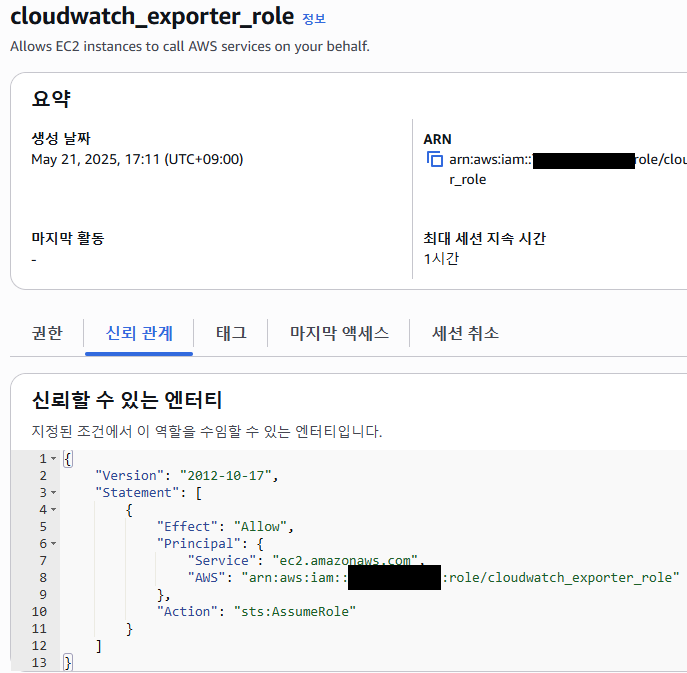
이렇게 Principal 내에
"AWS": "arn:aws:iam::acount_id:role/cloudwatch_exporter_role"를 추가해준다.
오류 해결 2
신규 IAM 정책
{
    "Version": "2012-10-17",
    "Statement": [
        {
            "Sid": "AllowReadingMetricsFromCloudWatch",
            "Effect": "Allow",
            "Action": [
                "cloudwatch:DescribeAlarmsForMetric",
                "cloudwatch:DescribeAlarmHistory",
                "cloudwatch:DescribeAlarms",
                "cloudwatch:ListMetrics",
                "cloudwatch:GetMetricData",
                "cloudwatch:GetInsightRuleReport",
                "cloudwatch:GetMetricStatistics"
            ],
            "Resource": "*"
        },
        {
            "Sid": "AllowReadingResourceMetricsFromPerformanceInsights",
            "Effect": "Allow",
            "Action": "pi:GetResourceMetrics",
            "Resource": "*"
        },
        {
            "Sid": "AllowReadingLogsFromCloudWatch",
            "Effect": "Allow",
            "Action": [
                "logs:DescribeLogGroups",
                "logs:GetLogGroupFields",
                "logs:StartQuery",
                "logs:StopQuery",
                "logs:GetQueryResults",
                "logs:GetLogEvents"
            ],
            "Resource": "*"
        },
        {
            "Sid": "AllowReadingTagsInstancesRegionsFromEC2",
            "Effect": "Allow",
            "Action": [
                "ec2:DescribeTags",
                "ec2:DescribeInstances",
                "ec2:DescribeRegions"
            ],
            "Resource": "*"
        },
        {
            "Sid": "AllowReadingResourcesForTags",
            "Effect": "Allow",
            "Action": "tag:GetResources",
            "Resource": "*"
        }
    ]
}
이 정책을 cloudwatch_exporter_role 에 추가

아래 명령어를 통해 로그 확인
docker logs --tail 50 --follow --timestamps a_acount_ec2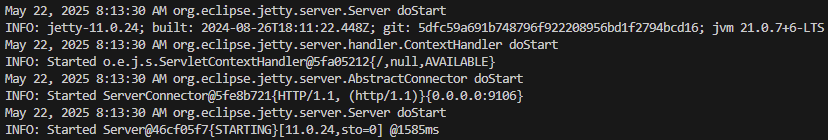
위 이미지처럼 뜨면 오류 해결
다시 prometheus 로 가서

aws_ec2_cpuutilization_average 확인
Grafana 로 이동

Code 로 변경 후 아래 코드 입력
instance_name 에 test 인 ec2 조회

aws_ec2_cpuutilization_average * on(instance_id) group_left(instance_name, tag_Name) (
  max by (instance_id, instance_name, tag_Name) (aws_resource_info{instance_name=~"(test).*"})
)

만약 aaa-1 서버와 bbb-2 서버인 경우
aws_ec2_cpuutilization_average * on(instance_id) group_left(instance_name, tag_Name) (
  max by (instance_id, instance_name, tag_Name) (aws_resource_info{instance_name=~"(aaa|bbb).*"})
)
그럼 이미지처럼 어떤 ec2인지 구별이 어려워짐.

ec2 이름으로 정리하는 방법
아래에 있는 옵션 클릭

Legend - Custom
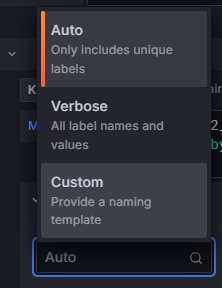

{{label_name}} -> {{instance_name}} 으로 변경하고 빈 곳 클릭

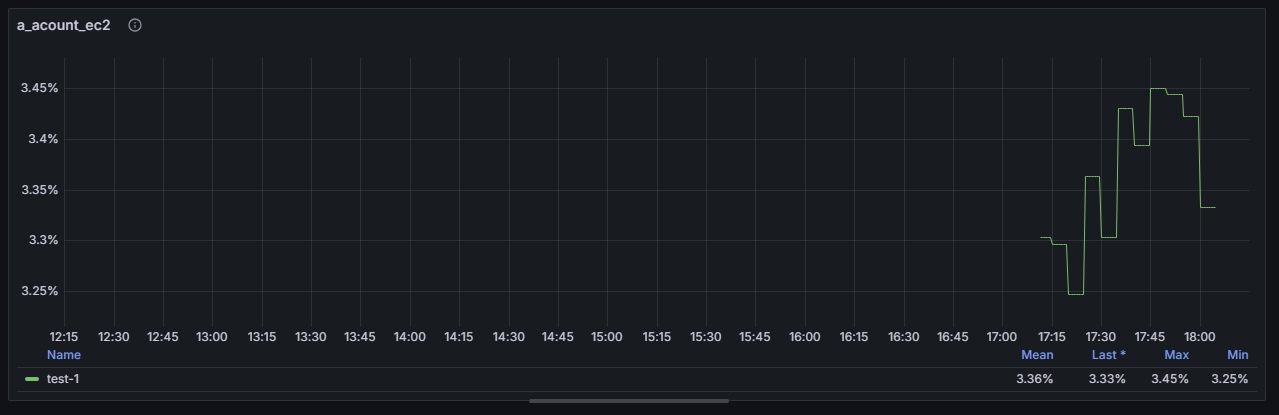
이미지처럼 인스턴스 name 만 조회가 됩니다.
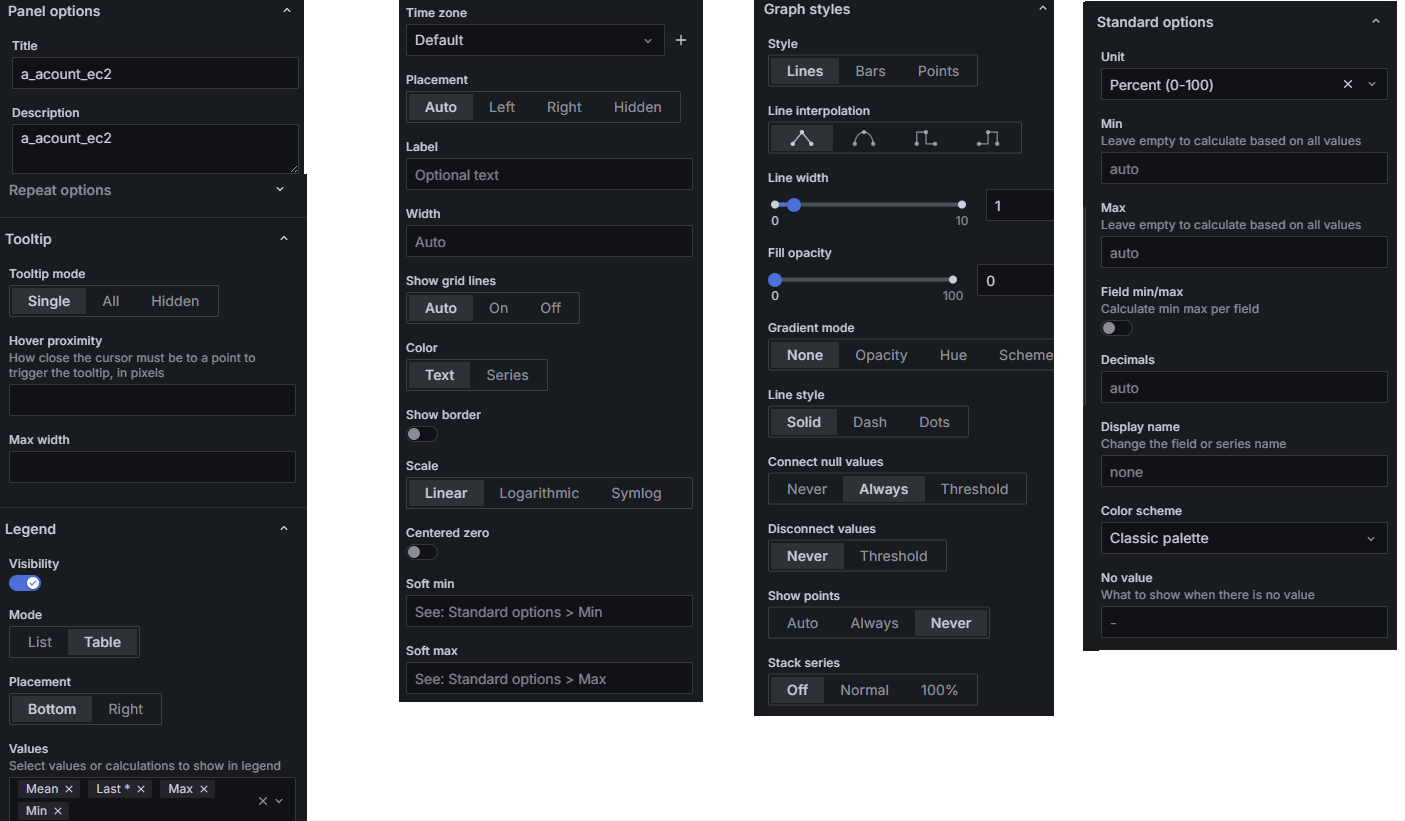
이제 그 외 뷰 설정 (보기 불편하지만 사진이 너무 길어서)
이렇게 설정하면
이런 식으로 확인 할 수 있습니다.
그리고 우측 상단 Refresh 에서 시간 단위를 변경하면 해당 시간에 맞게 새로고침을 하게 됩니다. (자주하면 비용 증가)

그 후 save dashboard.
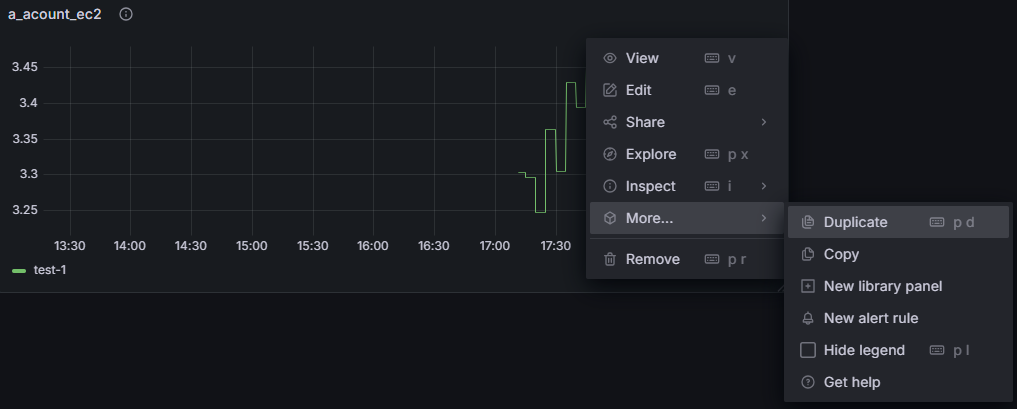
memory 모니터링
판넬의 ... 클릭 - More - Duplicate
cpu 와 동일하게 code 부분 수정
cwagent_mem_used_percent_average * on(instance_id) group_left(instance_name, tag_Name) (
  max by (instance_id, instance_name, tag_Name) (aws_resource_info{instance_name=~"(test).*"})
)

Disk 모니터링
판넬의 ... 클릭 - More - Duplicate
cwagent_disk_used_percent_average * on(instance_id) group_left(instance_name, tag_Name) (
  max by (instance_id, instance_name, tag_Name) (aws_resource_info{instance_name=~"(test).*"})
)
그럼 이렇게 cpu,mem,disk 모니터링이 가능하다.

그 외.
... 을 눌러도 Duplicate 가 안 뜰 때 우측 상단의 Edit 을 누른다.

대시보드 이름 변경

대시보드 클릭 후

Edit - Settings

여기서 대시 보드 이름을 변경할 수 있다.